Press Release · Cyngn
Cyngn Reports 2026 3rd Quarter Financial Results
Distributed by Stream Bulletin · Originally issued via PR Newswire
Enterprise adoption advances with a follow-on Fortune 100 order, record monthly fleet activity, and a completed SOC 2 Type II examination
Recent Operating Highlights
- Ended the quarter with $34.9 million in unrestricted cash and short-term investments and no debt.
- Announced a follow-on order from an existing Fortune 100 heavy equipment manufacturer, extending autonomous material handling into an additional assembly-line application.
- Strengthened enterprise security credentials, achieving ISO 27001 certification and completing a SOC 2 Type II examination with zero exceptions in October.
MOUNTAIN VIEW, Calif., Nov. 12, 2026 — Cyngn (NASDAQ: CYN) today announced financial results for its third quarter ended September 30, 2026, highlighting continued progress expanding adoption of its autonomous industrial vehicle technology.
During the quarter, Cyngn announced a follow-on order from an existing Fortune 100 heavy equipment manufacturer, extending DriveMod into an additional assembly-line material handling application. Building on an established customer relationship, the order illustrates Cyngn's strategy of expanding autonomous operations beyond initial deployments as manufacturers identify additional workflows suitable for automation.
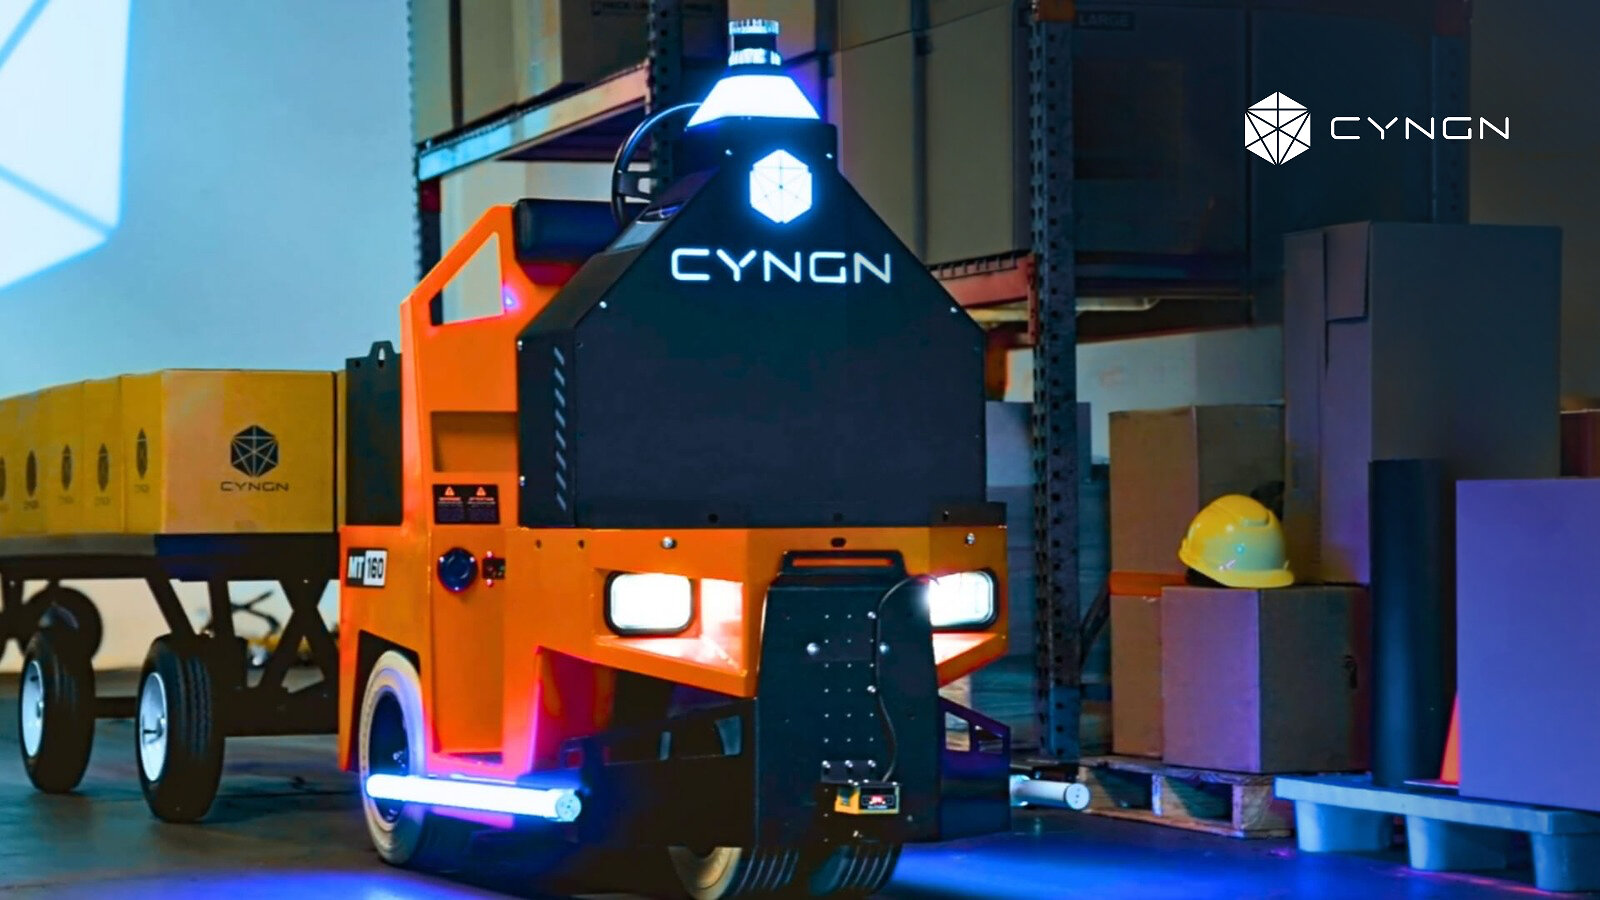
Cyngn also advanced initiatives to strengthen commercial execution and operating efficiency. Following changes to its sales organization, the Company implemented a more disciplined approach to customer qualification, pipeline accountability, and identifying applications aligned with the DriveMod Tugger. These efforts were accompanied by a streamlined organizational structure and expanded use of AI-assisted tools across engineering and business operations, with the objective of improving productivity and concentrating resources on priority initiatives.
The Company continued strengthening its capabilities to support enterprise customers. Cyngn announced its achievement of ISO 27001 certification in September and completed its inaugural SOC 2 Type II examination with zero exceptions in October, ahead of its previously announced year-end target. Together with its portfolio of 24 issued U.S. patents, these milestones reflect continued investment in the technology and security infrastructure supporting the Company's autonomous vehicle platform.
In October, Cyngn also formally announced the launch of DriveMod EasyLaunch™, a simplified deployment program offering qualifying customers one autonomous tugger, one route, and a single monthly payment without an upfront capital investment or long-term commitment. The program is designed to lower barriers to initial adoption while providing customers with a practical starting point for expanding autonomous material handling across additional workflows.
Q3 2026 Nine Month Financial Review:
Year-to-date third quarter revenue was $405.5 thousand compared to $150.9 thousand in the nine months ended September 30, 2025. Similar to prior year, year-to-date 2026 revenue consisted of EAS software subscriptions from DriveMod tugger vehicle deployments.
Total costs and expenses for the nine months ended September 30, 2026 were $20.5 million, an increase of $1.2 million or 6% from $19.3 million for the nine months ended September 30, 2025. This increase was due to a $1.2 million increase in general and administrative (G&A) expenses, primarily driven by an increase in board of director's pay in lieu of the equity component of the director compensation program for 2025 and an increase in marketing and advertising expenses. In addition, there was an increase of $281.2 thousand in cost of revenue due to the deployment costs being recognized over the life of the awarded contracts. This was offset by a $317.8 thousand decrease in research and development (R&D), primarily due to personnel costs driven by the change in accounting estimate related to capitalized software, partially offset by an increase in contractor fees and occupancy costs. For the nine months ended September 30, 2026, other income (expense), net remained consistent at $1.3 million compared to $1.3 million for the nine months ended September 30, 2025.
Net loss for the nine months ended September 30, 2026 was $(18.8) million compared to $(17.8) million in the nine months ended September 30, 2025. Net loss per share for the nine-month period was $(1.41), based on basic and diluted weighted average shares outstanding of approximately 13.3 million. This compares to a net loss per share of $(5.20) for the nine months ended September 30, 2025, based on approximately 3.4 million basic and diluted weighted average shares outstanding.
Q3 2026 Three Month Financial Review:
Revenue in Q3 2026 was $156.5 thousand compared to $70 thousand in the third quarter of 2025. Similar to prior year, third quarter of 2026 revenue consisted of EAS software subscriptions from DriveMod tugger vehicle deployments.
Total costs and expenses in the second quarter were $6.6 million, a decrease of $1.9 million or (23%) from $8.5 million in the third quarter of 2025. This decrease was primarily due to a $2.3 million decrease in research and development (R&D), primarily due to personnel costs driven by the change in accounting estimate related to capitalized software. This was partially offset by a $195.1 thousand increase in General and administrative (G&A), primarily driven by an increase in board of director's pay in lieu of the equity component of the director compensation program for 2025 and an increase in occupancy costs. In addition, There was an increase of $163.6 thousand in cost of revenue due to the deployment costs being recognized over the life of the awarded contracts. For the third quarter of 2026, other income (expense), net was $446.1 thousand compared to ($21.6) thousand in the third quarter of 2025. The increase in other income was primarily driven by income from short-term investments.
Net loss for the third quarter was $(6.0) million compared to $(8.4) million in the corresponding quarter of 2025. Third quarter net loss per share was $(0.41), based on basic and diluted weighted average shares outstanding of approximately 14.7 million in the quarter. This compares to a net loss per share of $(1.20) in the third quarter of 2025, based on approximately 7.0 million basic and diluted weighted average shares outstanding.
Balance Sheet Highlights:
Cyngn's unrestricted cash and short-term investments as of September 30, 2026 totaled $34.9 million compared to $34.7 million as of December 31, 2025. At the end of the same period, working capital was $34.3 million and total stockholders' equity was $39 million, as compared to year-end working capital of $35.7 million and total stockholders' equity of $38.8 million, respectively as of December 31, 2025. The Company had no debt as of September 30, 2026 and December 31, 2025 and to date, no member of the current management team has sold any shares of the Company's stock.
CYNGN INC. | ||||||||||||||||
Three Months Ended | Nine Months Ended | |||||||||||||||
September 30, | September 30, | |||||||||||||||
2026 | 2025 | 2026 | 2025 | |||||||||||||
Revenue | $ | 156,495 | $ | 69,973 | $ | 405,527 | $ | 150,851 | ||||||||
Costs and expenses | ||||||||||||||||
Cost of revenue | 214,428 | 50,816 | 360,761 | 79,574 | ||||||||||||
Research and development | 2,971,411 | 5,254,953 | 9,014,214 | 9,331,987 | ||||||||||||
General and administrative | 3,376,330 | 3,181,204 | 11,131,999 | 9,873,188 | ||||||||||||
Total costs and expenses | 6,562,169 | 8,486,973 | 20,506,974 | 19,284,749 | ||||||||||||
Loss from operations | (6,405,674) | (8,417,000) | (20,101,447) | (19,133,898) | ||||||||||||
Other income (loss), net | ||||||||||||||||
Interest income, net | 19,073 | (252,497) | 62,737 | (375,670) | ||||||||||||
Warrant liability issuance costs | ||||||||||||||||
Change in fair value of warrant liabilities | ‒ | ‒ | ‒ | 1,136,677 | ||||||||||||
Loss on issuance of warrants | ‒ | ‒ | ‒ | ‒ | ||||||||||||
Loss on deconsolidation of foreign subsidiary | ‒ | ‒ | ‒ | ‒ | ||||||||||||
Other income, net | 426,985 | 230,856 | 1,237,825 | 574,291 | ||||||||||||
Total other income (loss), net | 446,058 | (21,641) | 1,300,562 | 1,335,298 | ||||||||||||
Net loss | $ | (5,959,616) | $ | (8,438,641) | $ | (18,800,885) | $ | (17,798,600) | ||||||||
Net loss per share attributable to common stockholders, | $ | (0.41) | $ | (1.20) | $ | (1.41) | $ | (5.20) | ||||||||
Weighted-average shares used in computing net loss per | 14,714,857 | 7,039,266 | 13,291,330 | 3,424,032 | ||||||||||||
CYNGN INC. | ||||||||
September 30, | December 31, | |||||||
2026 | 2025 | |||||||
ASSETS | ||||||||
CURRENT ASSETS | ||||||||
Cash and cash equivalents | $ | 3,081,033 | $ | 990,023 | ||||
Short-term investments | 31,801,167 | 33,736,091 | ||||||
Accounts and other receivables | 928,194 | 1,544,213 | ||||||
Inventory | 1,630,299 | 2,039,655 | ||||||
Prepaid expenses and other current assets | 816,490 | 885,800 | ||||||
TOTAL CURRENT ASSETS | 38,257,183 | 39,195,782 | ||||||
NON-CURRENT ASSETS | ||||||||
Property and equipment, net | 4,587,282 | 3,268,196 | ||||||
Right of use asset, net | 5,318,512 | 5,971,800 | ||||||
Intangible assets, net | 446,996 | 466,223 | ||||||
Other non-current assets | 1,292,681 | 1,151,214 | ||||||
TOTAL NON-CURRENT ASSETS | 11,645,471 | 10,857,433 | ||||||
TOTAL ASSETS | $ | 49,902,654 | $ | 50,053,215 | ||||
LIABILITIES AND STOCKHOLDERS' EQUITY | ||||||||
CURRENT LIABILITIES | ||||||||
Accounts payable | $ | 559,140 | $ | 217,439 | ||||
Deferred revenue | 575,289 | 395,348 | ||||||
Current operating lease liability | 984,478 | 312,365 | ||||||
Accrued expenses and other current liabilities | 1,861,157 | 2,615,734 | ||||||
TOTAL CURRENT LIABILITIES | 3,980,064 | 3,540,886 | ||||||
NON-CURRENT LIABILITIES | ||||||||
Non-current deferred revenue | 1,251,629 | 1,262,667 | ||||||
Non-current operating lease liability | 5,691,752 | 6,495,256 | ||||||
TOTAL NON-CURRENT LIABILITIES | 6,943,381 | 7,757,923 | ||||||
TOTAL LIABILITIES | 10,923,445 | 11,298,809 | ||||||
Commitments and Contingencies (Note 13) | ||||||||
STOCKHOLDERS' EQUITY | ||||||||
Common stock, Par $0.00001; 400,000,000 shares authorized as of | 153 | 80 | ||||||
Additional paid-in capital | 274,602,412 | 255,576,797 | ||||||
Accumulated deficit | (235,623,356) | (216,822,471) | ||||||
TOTAL STOCKHOLDERS' EQUITY | 38,979,209 | 38,754,406 | ||||||
TOTAL LIABILITIES AND STOCKHOLDERS' EQUITY | $ | 49,902,654 | $ | 50,053,215 | ||||
CYNGN INC. | ||||||||
Nine Months Ended | ||||||||
September 30, | ||||||||
2026 | 2025 | |||||||
CASH FLOWS FROM OPERATING ACTIVITIES | ||||||||
Net loss | $ | (18,800,885) | $ | (17,798,600) | ||||
Adjustments to reconcile net loss to net cash used in operating activities: | ||||||||
Depreciation and amortization | 928,756 | 894,312 | ||||||
Stock-based compensation | 1,109,795 | 1,347,987 | ||||||
Realized gain on short-term investments | (18,167) | (85,117) | ||||||
Accretion on short-term investments | (1,145,864) | (459,977) | ||||||
Loss on disposed assets | 14,464 | 11,429 | ||||||
Change in fair value of warrant liability | ‒ | (1,136,677) | ||||||
Change in estimate of capitalized software | ‒ | 2,590,491 | ||||||
Change in assets and liabilities: | ||||||||
Accounts and other receivables | 616,019 | (481,492) | ||||||
Inventory | 409,356 | (735,260) | ||||||
Prepaid expenses, operating lease right-of-use assets, and other assets | (72,157) | (1,542,030) | ||||||
Accounts payable | 341,700 | 112,638 | ||||||
Deferred revenue | 168,903 | 240,210 | ||||||
Accrued expenses, lease liabilities, and other current liabilities | (885,969) | 206,544 | ||||||
Net cash used in operating activities | (17,334,049) | (16,835,542) | ||||||
CASH FLOWS FROM INVESTING ACTIVITIES | ||||||||
Purchase of property and equipment | (1,581,203) | (872,369) | ||||||
Acquisition of intangible asset | (8,587) | (1,190,613) | ||||||
Disposal of assets | ‒ | ‒ | ||||||
Purchase of short-term investments | (59,824,258) | (62,710,899) | ||||||
Proceeds from maturity of short-term investments | 62,923,214 | 33,201,501 | ||||||
Net cash used in investing activities | 1,509,166 | (31,572,380) | ||||||
CASH FLOWS FROM FINANCING ACTIVITIES | ||||||||
Proceeds from at-the-market equity financing, net of issuance costs | 9,166,427 | ‒ | ||||||
Proceeds from public issuance of common stock, net of offering costs | 8,749,467 | 29,611,678 | ||||||
Issuance costs for public issuance of common stock and pre-funded warrants and | ‒ | (1,025) | ||||||
Issuance costs for stock dividend and restricted stock units | ‒ | ‒ | ||||||
Net cash provided by financing activities | 17,915,893 | 29,610,653 | ||||||
Net increase in cash and cash equivalents | 2,091,010 | (18,797,269) | ||||||
Cash and cash equivalents at beginning of period | 990,023 | 23,617,733 | ||||||
Cash and cash equivalents at end of period | $ | 3,081,033 | $ | 4,820,464 | ||||
Supplemental disclosure: | ||||||||
Recognition of operating lease right-of-use assets and operating lease liabilities | $ | ‒ | $ | 274,659 | ||||
Acquisition of property and equipment included in accounts payable and accrued | $ | 42,578 | $ | 30,261 | ||||
Acquisition of right-of-use asset in exchange for new operating lease obligation | $ | ‒ | $ | 6,589,332 | ||||
Investor Contact:
Natalie Russell
CFO
[email protected]
Media Contact:
Luke Renner
Head of Marketing
[email protected]
Where to Find Cyngn:
- Website: https://cyngn.com
- X: https://x.com/cyngn
- LinkedIn: https://www.linkedin.com/company/cyngn
- YouTube: https://www.youtube.com/@cyngnhq
Forward-Looking Statements
This press release contains forward-looking statements within the meaning of the Private Securities Litigation Reform Act of 1995, Section 27A of the Securities Act of 1933, as amended, and Section 21E of the Securities Exchange Act of 1934, as amended. Any statement that is not historical in nature is a forward-looking statement and may be identified by the use of words and phrases such as "expects," "anticipates," "believes," "will," "will likely result," "will continue," "plans to," "potential," "promising," and similar expressions. These statements are based on management's current expectations and beliefs and are subject to a number of risks, uncertainties and assumptions that could cause actual results to differ materially from those described in the forward-looking statements, including the risk factors described from time to time in the Company's reports to the Securities and Exchange Commission (SEC), including, without limitation the risk factors discussed in the Company's annual report on Form 10-K filed with the SEC on March 26, 2026. Readers are cautioned that it is not possible to predict or identify all the risks, uncertainties and other factors that may affect future results. No forward-looking statement can be guaranteed, and actual results may differ materially from those projected. Cyngn undertakes no obligation to publicly update any forward-looking statement, whether as a result of new information, future events, or otherwise.
SOURCE Cyngn
About Cyngn
Cyngn develops and deploys autonomous vehicle technology for industrial organizations like manufacturers and logistics companies. The Company addresses significant challenges facing industrial organizations today, such as labor shortages and costly safety incidents.
Cyngn's DriveMod technology empowers customers to seamlessly bring self-driving technology to their operations without high upfront costs or infrastructure installations. DriveMod is currently available on Motrec MT-160 Tuggers.
The DriveMod Tugger hauls up to 12,000 lbs, travels inside and out, and targets a typical payback period of less than 2 years.